A typical passenger car in India emits 0.13 to 0.20 kg of CO2 per kilometre, depending on fuel type, engine size, and driving conditions. For a car driven 10,000 km annually, that is roughly 1.3 to 2.0 tonnes of CO2 a year from tailpipe alone. India’s transport sector contributes around 8 percent of national greenhouse gas emissions, with road transport at roughly 88 percent of that share.
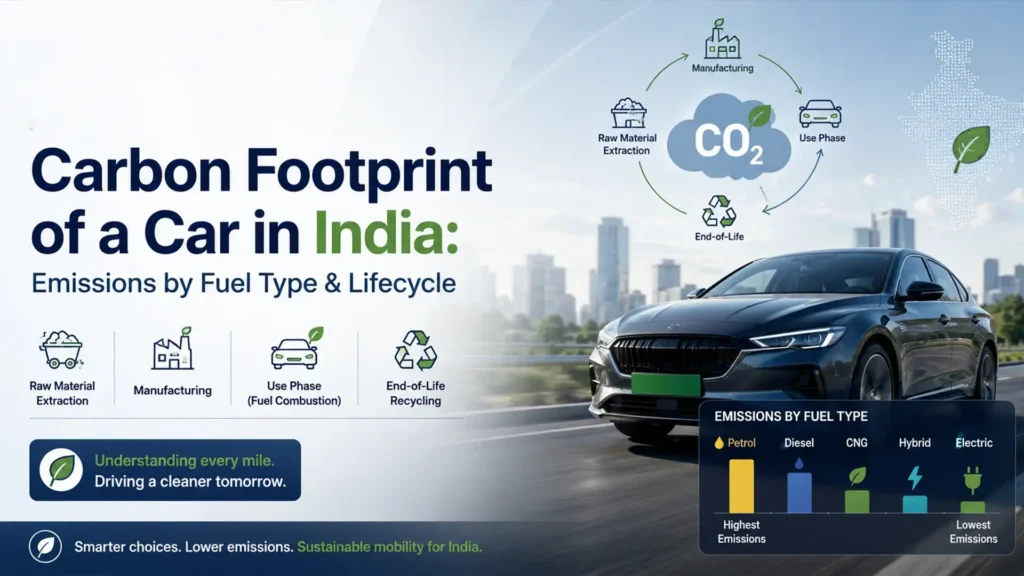
Tailpipe emissions are only part of the picture. The full carbon footprint of a car in India spans its lifecycle, from manufacturing and fuel production through operation to end-of-life disposal. Understanding where those emissions come from, how they vary by fuel type and vehicle age, and what emission standards require is essential for vehicle owners, fleet operators, and OEMs making fleet and sustainability decisions.
Car Emission Factors in India by Vehicle and Fuel Type
Tailpipe emission factors vary by vehicle segment, engine size, and fuel type. The figures below are operational use-phase emissions; manufacturing and fuel production are covered in the next section. Real-world car CO2 emissions India operators see also vary with driving style, traffic, and maintenance.
| Segment | Petrol | Diesel | CNG | EV (well-to-wheel) |
| Small Hatchback | 0.12 to 0.14 | 0.11 to 0.13 | 0.06 to 0.08 | 0.07 to 0.09 |
| Mid-size Sedan | 0.15 to 0.18 | 0.14 to 0.17 | 0.08 to 0.10 | 0.08 to 0.10 |
| Compact SUV | 0.17 to 0.20 | 0.16 to 0.19 | 0.09 to 0.11 | 0.09 to 0.11 |
| Large SUV | 0.20 to 0.28 | 0.19 to 0.26 | 0.11 to 0.14 | 0.10 to 0.13 |
Figures in kg CO2 per kilometre, sourced from Shakti Sustainable Energy Foundation and IEA data; EV figures include India’s current grid mix, which is roughly 60 to 70 percent coal-dependent. CNG produces close to half the CO2 per kilometre of a comparable petrol vehicle, which makes it one of the most carbon-efficient options inside existing ICE infrastructure. The petrol vs EV emissions India comparison shows EVs already emit measurably less per km than equivalent petrol vehicles even on the present grid, and that gap widens as renewable share rises.
Readers comparing fuel options in detail can review the practical levers in how to reduce automotive carbon emissions before mapping these figures to fleet decisions.
Lifecycle Carbon Footprint of a Car in India
The full lifecycle emissions car India accounts for spans three distinct phases. Each phase contributes a different slice of total carbon, and ignoring any one of the three understates a vehicle’s real footprint. The methodology that splits the three phases is detailed further in automotive lifecycle emissions.
Manufacturing Phase
Manufacturing a typical passenger car generates approximately 5.6 to 7 tonnes of CO2 equivalent. This figure includes steel production, component manufacturing, vehicle assembly, and inbound logistics. EV manufacturing carries a higher upfront carbon cost, driven mainly by battery production.
- A 40 kWh battery pack generates approximately 4 to 8 tonnes of CO2 in production, depending on the energy mix at the manufacturing facility.
- EVs in India recover the manufacturing deficit within 2 to 4 years of operation against ICE vehicles in equivalent segments.
- Battery chemistry, cell manufacturing location, and grid carbon intensity at the cell plant drive most of the variability in EV cradle-to-gate numbers.
Operation Phase
For a petrol car driven 150,000 km over its lifetime, operational emissions total approximately 19 to 30 tonnes of CO2, the dominant share of any ICE vehicle’s lifecycle carbon. The petrol vs EV emissions India comparison gets sharper at this stage.
- An IIT Roorkee and ICCT meta-analysis published in 2025 found that EVs in India emit 14 to 38 percent less CO2 equivalent over a 150,000 km lifetime than ICE vehicles.
- Three factors drive 75 percent of variability in EV lifecycle emissions car India studies report: grid carbon intensity, lab versus real-world energy consumption, and driving conditions.
- ICE vehicles bought today will be on the road for 10 to 15 years, while EVs improve automatically as the grid decarbonises across that same period.
End-of-Life Phase
End-of-life emissions are smaller in absolute terms than manufacturing or operation, but the way a vehicle is handled at end-of-life has measurable downstream consequences. Compliant disposal recovers materials that would otherwise be produced from virgin sources, which avoids a meaningful share of new manufacturing emissions.
- Compliant ELV disposal at a Registered Vehicle Scrapping Facility recovers approximately 754 kg of steel per typical passenger vehicle, displacing virgin steel production.
- Informal scrapping that allows fluids to leak or burn plastics generates avoidable emissions and direct local environmental harm.
- With 50 percent solar charging assumed, lifecycle EV emissions reduce by approximately 61 percent versus ICE according to the SAE India LCA study published in 2026.
India’s Emission Standards and What They Require
India regulates vehicle emissions through two parallel frameworks. Bharat Stage norms set per-vehicle pollutant limits, while CAFE standards India emissions rules apply at the manufacturer fleet level. Together they shape what is sold, how it is sold, and what counts as compliant.
Bharat Stage Emission Norms
BS6, equivalent to Euro 6, has been mandatory for all new vehicles sold since April 2020. BS6 Phase 2 introduced Real Driving Emissions standards from April 2023, requiring vehicles to meet limits under real-world conditions, not only laboratory test cycles. The full technical scope is documented in BS6 norms in India.
- BS6 Phase 2 reduced permissible NOx, particulate matter, and hydrocarbon emissions from new vehicles relative to earlier phases.
- A pre-BS6 vehicle on BS3 or BS4 norms can legally emit 2 to 3 times more NOx than a BS6 vehicle.
- Particulate matter limits were significantly less stringent under BS3 and BS4 than under current BS6 rules.
CAFE Standards
CAFE standards India emissions targets are fleet-average CO2 obligations on vehicle manufacturers, not on individual vehicles. CAFE Phase 2, tightened in 2022, requires a fleet average of 113 g CO2/km, down from the Phase 1 standard of 130 g CO2/km.
- CAFE compliance pushes OEMs to sell more fuel-efficient and lower-emission vehicles to offset higher-emitting models.
- Upcoming CAFE Phase 3 standards are expected to lower fleet averages further, accelerating EV and hybrid integration.
- Real-world emissions typically exceed CAFE test-cycle figures by 15 to 25 percent.
How Vehicle Age Affects Carbon Footprint and Why Old Cars Emit More
A vehicle’s per-kilometre carbon footprint rises as it ages, for reasons beyond fuel efficiency alone. Engine degradation slowly increases fuel consumption: worn piston rings, injector fouling, and catalyst deterioration raise both CO2 and particulates. Emission control systems also degrade, since catalytic converters lose effectiveness and older vehicles on BS3 or BS4 norms lack the after-treatment required by BS6.
Maintenance gaps compound the problem. Older vehicles are often under-maintained relative to manufacturer schedules, and a poorly serviced older car can emit several times the CO2 of a modern equivalent under the same conditions. Studies consistently show that a small share of the oldest, most polluting vehicles accounts for a disproportionate share of fleet-level transport emissions in Indian cities. Removing high-emission aged vehicles is the operational logic behind the vehicle scrappage policy in India.
Vehicles that fail fitness tests at Automated Testing Stations are designated as end-of-life and routed through Registered Vehicle Scrapping Facilities for compliant disposal. The Certificate of Deposit issued at scrapping entitles the owner to a purchase rebate on a new vehicle, which turns the carbon cost of an ageing vehicle into an economic incentive to upgrade. MMCM’s AutoLoop supports RVSFs in capturing the dMRV data points that translate each compliant scrappage event into verified carbon savings under the Cercarbono methodology, which quantifies approximately 0.6 tons of CO2e savings per ton of ELV responsibly scrapped.
Conclusion
The vehicle carbon footprint India of a passenger car is shaped by fuel type, engine size, driving conditions, vehicle age, and the grid energy mix. A small petrol hatchback driven 10,000 km a year emits roughly 1.3 tonnes of CO2 annually, while a large SUV can emit more than double that. Over a full lifetime, a petrol car generates 28 to 42 tonnes of CO2 equivalent, which EVs reduce by 14 to 38 percent today and more as the grid decarbonises. Reducing the carbon footprint of a car in India requires every lever at once: tighter standards, faster EV adoption, cleaner grid energy, and authorised retirement of the oldest, most polluting vehicles, with the cost-benefit detailed in benefits of vehicle scrapping in India.
FAQs
What is the carbon footprint of a car in India?
The carbon footprint of a car in India is total CO2 equivalent emissions across its lifecycle: manufacturing, fuel production, operation, and end-of-life. A typical passenger car emits 0.13 to 0.20 kg of CO2 per kilometre operationally, plus 5.6 to 7 tonnes during manufacturing.
How much CO2 does a petrol car emit per kilometre in India?
A petrol car in India emits approximately 0.13 to 0.20 kg of CO2 per kilometre, depending on engine size, weight, and driving conditions. Small hatchbacks sit at the lower end, while large SUVs reach 0.20 to 0.28 kg per kilometre under real Indian traffic.
Do EVs have a lower carbon footprint than petrol cars in India?
Yes. EVs in India emit 14 to 38 percent less CO2 equivalent over 150,000 km than ICE vehicles, per the IIT Roorkee and ICCT meta-analysis published in 2025. Despite higher battery manufacturing emissions, EVs recover the deficit within 2 to 4 years of operation.
What are BS6 emission norms in India?
BS6 norms are India’s vehicle emission standards, equivalent to Euro 6, mandatory for all new vehicles since April 2020. BS6 Phase 2, in effect from April 2023, requires Real Driving Emissions compliance under real-world conditions, not just laboratory cycles.
What are CAFE standards in India?
CAFE Standards India emissions targets are fleet-average CO2 obligations on vehicle manufacturers, not individual vehicles. CAFE Phase 2 mandates a fleet average of 113 g CO2/km, down from 130 g CO2/km in Phase 1, pushing OEMs toward fuel-efficient and electrified portfolios.
Does an older car emit more CO2 than a new car?
Yes. Older cars emit more CO2 per kilometre because of engine degradation, catalytic converter wear, maintenance gaps, and weaker emission control on BS3 and BS4 vehicles. A pre-BS6 vehicle can legally emit 2 to 3 times more NOx than a BS6 vehicle, and real-world CO2 climbs with age.
How does vehicle scrapping reduce carbon footprint?
Authorised vehicle scrapping cuts fleet-level carbon by removing the highest-emitting old vehicles and replacing them with newer BS6 or electric models. Compliant scrapping at an RVSF also recovers around 754 kg of steel per vehicle, which displaces virgin steel production and the associated manufacturing emissions.